

Editor’s Note
In just a couple weeks, the Virginia Department of Education is expected to release results from the 2026 Standards of Learning (SOL) testing.
This data is the clearest picture currently available into how students in any given school or district are collectively performing academically. Interpreting these scores, however, has been the subject of considerable debate in recent years.
When a school’s average SOL score in a given subject is deemed “Proficient,” what does that mean?
One approach to answering that question is correlating SOL scores to results on The Nation’s Report Card. That approach has led critics to charge that Virginia’s exams display an “Honesty gap.” That is, Virginia SOLs show a considerably higher percentage of students being identified as “Proficient” than does the NAEP exam, often called The Nation’s Report Card.
The challenge is that The Nation’s Report Card is a sampling exam taken by a small percentage of Virginia students, while nearly every student has to take SOLs. Further, NAEP’s questions are not tied to Virginia’s standards, but to the content frameworks established by the National Assessment Governing Board. In short, students could be answering questions based on content they had covered earlier in their education, have yet to cover, or are scheduled to cover after The Nation’s Report Card exam is administered. Or, they could be tested on material Virginia’s standards do not include.
Another challenge of SOL scores is that people will look at rising or declining scores for a given school or district across a number of years to reach conclusions about that school’s or district’s increasing or decreasing success.
The problem? The goalpost is constantly shifting on the SOLs, with cut scores rising and falling as well as standards shifting every few years. This makes comparing scores from year-to-year within the same school or district challenging.
To solve the latter problem, Matt Hurt of the Comprehensive Instructional Program has developed a method for better understanding how academic achievement is improving or declining relative to other schools and districts in Virginia using SOL data.
The Virginia Free Press is partnering with Hurt to deliver to readers a fresh way of looking at SOL test scores.
Together, we will publish a report following the release of SOL scores that allows people to see how their district is doing relative to other districts in the state, and to also see the relative progress or decline that district has experienced in recent years.
In this column, Hurt explains the method he has developed to rank-order districts.
Background
Virginia implemented Standards of Learning and the corresponding assessments in the mid 1990s to combat declining student achievement relative to other states. This bipartisan educational reform began with the adoption of educational standards for English, History, Math, and Science in 1995. The Standards of Learning assessments were first implemented in 1998. The purpose of these assessments was to hold Virginia educators responsible for adhering to these standards. The implementation of this accountability culminated in the 2007 school year when schools could lose state accreditation for poor performance.
Moving the Goal Posts
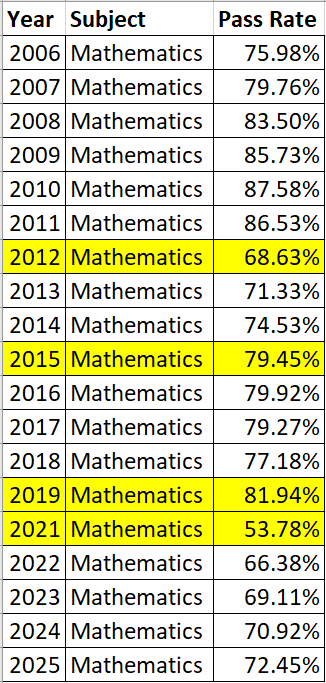
Over the years a number of changes have taken place which have resulted in proficiency rates improving or declining statewide. Table 1 below displays the overall pass rates for all math SOL tests taken in Virginia. The years in which significant differences in pass rates are shaded in yellow.
- In 2012 Technology Enhanced Items were implemented for the first time. Prior to that year all SOL test items were multiple choice format. Technology Enhanced Items afforded the ability to assess higher order thinking skills through formats such as drag and drop, multiple select, graphing and plotting, and many other types. These items increased the rigor of the tests and there was a significant decline in student performance accordingly.
- In 2015 elementary and middle school students were allowed expedited retakes for the first time. High school students had been afforded this opportunity for years prior. If a student narrowly failed their SOL test (375-399 test scaled score range), students were allowed a second attempt after receiving remediation. This resulted in significant improvements in outcomes.
- In 2019 the Virginia Board of Education lowered SOL cut scores in Math. The expectations bar was lowered, and more students were immediately able to cross it.
- The 2021 results indicate the impact of many students working from home. Anecdotally many teachers report that some students utilized technology to complete their assignments for them, not learning the skills for themselves. The SOL tests are conducted under standardized testing conditions where students do not have access to such tools. Also to be factored into this number is the fact that 33% fewer SOL tests were administered in 2021, partially due to relaxing the student participation requirement due to Covid concerns.
Table 1: Virginia Statewide SOL Pass Rates- All Math SOL Tests
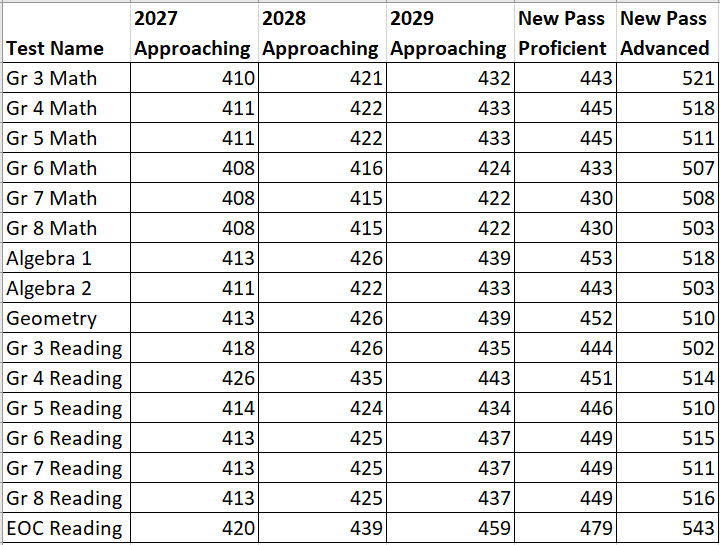
This year (2026-2027) Virginia will be implementing higher cut scores on the Reading and Math SOL tests. The implementation schedule adopted by the Board of Education requires cut scores to be phased in over the course of four years. During the 2027, 2028, and 2029 school years, the approaching cut score for each course will be used to award the same points as proficient scores in the School Performance and Support Framework accountability system. Students in high school will also receive verified credit if they achieve the new approaching cut score. By the 2030 school year, the approaching cuts will no longer be applicable.
Table 2: New SOL Cut Scores and Adopted by the Virginia Board of Education
Reasonable Evaluation
Because of all of these changes over the years, it is not reasonable to evaluate these results by simply comparing pass rates. By using relative metrics, such as rankings, the changes in state policy, testing requirements, test rigor, cut scores, etc can be largely mitigated.
For example, when the state made the decision to increase the cut scores, that will impact every school and school division in the Commonwealth. Some will be proactive and take steps to increase rigor in their classrooms, and their proficiency rates won’t decline as much as others. Some schools and divisions will not be as proactive and their proficiency rates will decline more with the implementation of the higher standards.
Methodology
Late each August, VDOE publicly releases the SOL data from the previous year. The VDOE SOL Build-A-Table site allows anyone to access school and school division SOL results back to 2006. There are also a number of filters which allow users to access statistics per core area (Reading, Writing, Math, Science, and History), by test (Grade 3 Reading, Civics, Grade 7 Math, Chemistry, etc), and by subgroup (white students, black students, students with disabilities, economically disadvantaged students, etc).
Each year we download this data to calculate and compile ranking statistics for each district in Virginia. From the average SOL pass rates that are supplied by the state, we simply rank-order them.
Data for 2025
Below is a link to the rankings for all 131 school divisions in Virginia from 2021 – 2025. For each year, the division’s ranking shows how it performed on the SOL relative to all other school divisions in Virginia.
From 2006 through 2022 there were 132 school divisions in Virginia. In 2023, Alleghany County and Covington City merged their school divisions into Alleghany Highlands Public Schools, leaving one hundred and thirty-one divisions since. The school division with the highest score is first, and the division with the lowest score is ranked one hundred thirty-first.
While many divisions will show relatively little change from year-to-year, there are notable exceptions. Lee County Public Schools, for example, from a rank of 90th in 2021 to 60th in 2025. This increase in ranking suggests that the district has found a way to improve academic performance. What the data doesn’t show is why it has improved or the methods that were explored. Answering those questions requires more analysis.
You can find the complete list of state data rankings from 2021-2025 here.