
VFP: Let’s begin with understanding drought. How is it defined?
Cloe: Drought is simply when there is a deficit in precipitation that creates some sort of impact. There are four types of drought that we at the Department of Environmental Quality (DEQ) look at:
- Meteorological Drought– This occurs when there is below normal rainfall. It’s also what drives other types of drought. A region can be in a meteorological drought and not have too many problems. But if it’s sustained over a period of time one starts seeing the other types of droughts.
- Hydrological Drought – This occurs when deficits in stream flows and groundwater levels and reservoir levels appear due to a lack of rain.
- Agricultural Drought – This occurs when the lack of rain begins to affect the agricultural industry with dry fields and low yields and damage to existing crops.
- Water Supply Drought – This type of drought brings all the others into play and we begin to see a loss of capacity for utilities to provide potable water for their customer base.
When assessing drought in the commonwealth, we look at each of these when assessing severity.
VFP: One type of drought you don’t mention is “flash” drought. Can you define that?
Cloe: These are droughts that come on suddenly. They occur when the weather gets really hot very quickly, and the existing landscape – be it tree-covered or not – experiences increased evaporation that leads to immediate hydrologic stress in the streams and in the ponds.
We’ve seen some of these in the Shenandoah Valley over the past few years. Things are going along well, and over a period of a few weeks these flash droughts take hold and intensify. It’s broken only when we get adequate rainfall to alleviate the drought.
VFP: The DEQ site provides several ways for people to understand the drought situation in Virginia. One of these is the Virginia Drought Update, and below is a screen capture of that update for August 25, 2026. Can you walk us through what we are looking at?
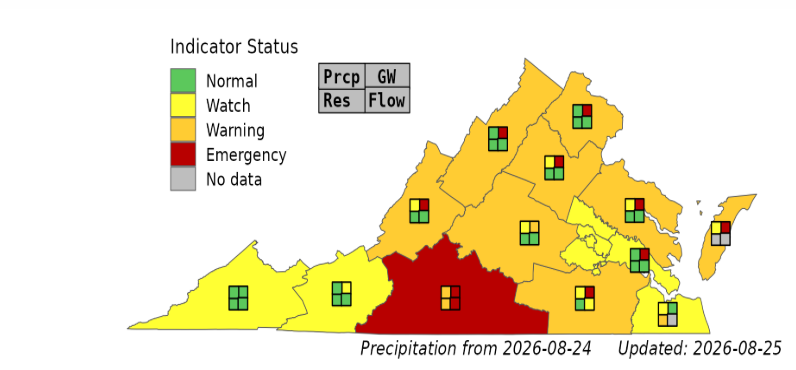
Cloe: The map is divided into 13 “Drought Evaluation Regions” that were established in 2003 following a drought of record. These regions loosely follow watersheds, but they also follow political boundaries for ease of bringing different localities into advisory statuses.
The 13 regions are evaluated independently based on four metrics, represented by four squares that correspond to the metrics we look to when evaluating conditions in those regions. There’s Precipitation (Prcp), Groundwater (GW), Stream Levels (Flow), and Reservoir Levels (Res).
They’re in different categories based on a percentile analysis of the time of year. DEQ goes by a hydrologic year (October to October). We’re looking at where a stream should be this time of year, historically, and then we compare it to what it actually is. Different thresholds lead to different advisory levels.
- Green – Everything is okay.
- Yellow – Drought Watch
- Orange – Drought Warning
- Red – Emergency
When we see those squares fill up, that helps us make decisions about the status of that region in terms of drought.
It’s all framed under the Drought Monitoring Task Force. This is a body of state and federal agencies responsible for evaluating water resources. DEQ chairs the task force.
We meet as a group and start by looking at the four squares, which are a starting point for our discussion.
Most recently we had all four squares red in the Roanoke region, and it was the first time since 2002 that we moved toward a drought emergency. That caused a lot of concerns about what that means. Normally it leads to the governor issuing an executive order, but we were standing back because we were hearing from our water suppliers that yes, it’s an emergency, but we still have capacity. They implemented some measures to prevent it from getting worse.
VFP: Can you describe the different advisory states and what they mean?
Cloe: There are three advisory states.
- Watch – Conditions are right for a drought to occur. Utilities may want to consider implementing voluntary measures for their customer base.
- Warning – Serious drought is imminent, but measures imposed by local utilities are still voluntary. Most of the commonwealth is in emergency or watch, but there are some 410 systems and localities that have some sort of restrictions or conservation measures in place.
- Emergency – We’re seeing levels below the 5th percentile on streams and groundwater, and the reservoirs are getting depleted because of a lack of rainfall. This is where we were in Roanoke, but things have recently improved due to more rainfall.
When setting these advisory levels, we look at more than the data we receive.
We also poll and reach out to localities through the health department, which checks on capacity levels and how the utilities are doing.
Currently, most all of the utilities are doing ok. We attribute this to efforts over the past 20 years in which facilities have become more sophisticated in their ability to measure climatological changes.
VFP: How often are the graphs updated?
Cloe: Within the past year, the Drought Monitoring Task Force has been meeting every other week. We just recently moved to every week. We could change the graphs regularly, but we don’t. We try not to ping-pong between green, yellow, and red. We look for trends before we make a jump.
We recently moved to downgrade a couple of our evaluations out west, as well as some in the York-James river region, where we had seen steady improvements for a few weeks and felt comfortable based on those improvements and forecasts to move from warning to watch.
VFP: When thinking about drought, DEQ is comparing water levels now to historical levels. How far back does this data go?
Cloe: With reservoir levels, we have records from its creation to now. For gauges on stream flows and wells and groundwater, we only use those for which we have at least 10 years of records. Some of these gauges go back decades.
Recently, we added 20 wells west of I-95 so that we can be better informed of drought in that part of the state. We are getting records from those now, but we don’t use them to inform drought decisions because we don’t have a long enough record.
VFP: While the Drought Update map is useful, there’s a new Drought Dashboard that provides a greater level of detail. Can you walk us through this dashboard?
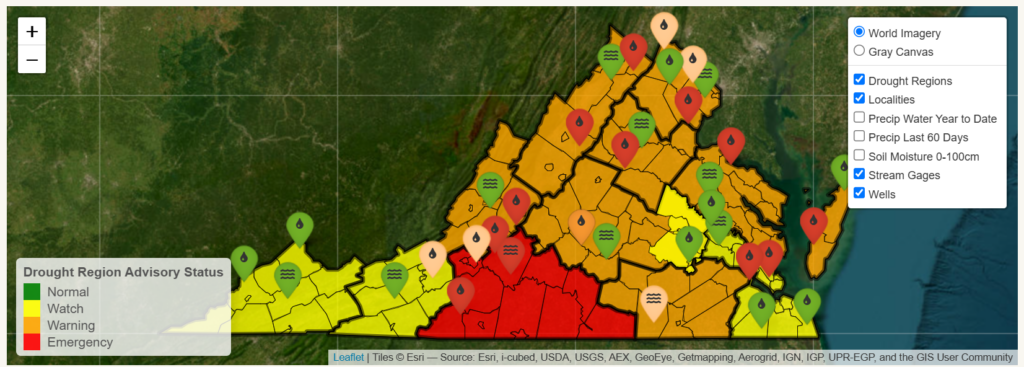
Cloe: Yes. This is a more-interactive map that allows users to explore stream gauges and groundwater wells.
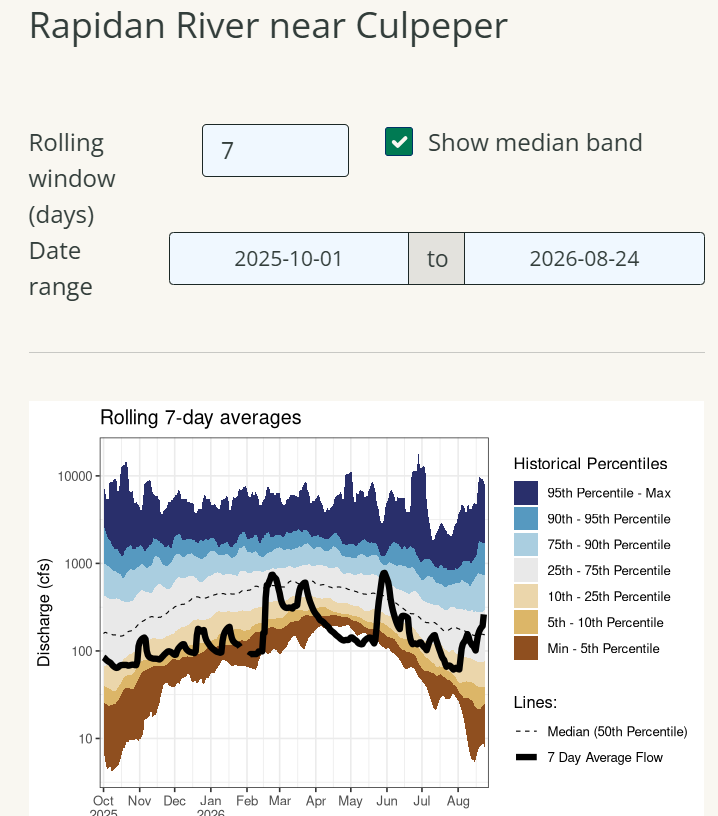
For example, when clicking through the teardrop icon with three squiggly lines, you will see a rolling 7-day average of where the stream is now, and where it stands historically.
Here, for example, is the gauge for the Rapidan River near Culpeper.
These are the wells and stream gauges we use when we are making these calls.
VFP: How are these measurements collected?
Cloe: Everything is measured by telemetry. These are all real-time stations that have doppler radar uplinked to satellites; in the wells there are pressure transducers that are uploaded to the USGS where all the data resides. We also have a team in Charlottesville that is responsible for maintaining 88 stream gauges across the state. In addition there’s groundwater characterization and monitoring program in Glen Allen. Their job is to do for groundwater what our Charlottesville team does for stream gauges.
VFP: How do you measure groundwater?
Cloe: There are direct measurements that one can make with wells. And there are two additional types of measurements. One is to pop a cap and drop a tape until you hit water and record the number. We do this to help calibrate our instrumentation. There’s also a pressure transducer, which measures the pressure above the head and turns that into a level reading.
Using this data, we can model the data to measure what the groundwater situation looks like over the landscape. We use this data to make permitting decisions.
VFP: How have cuts at the federal level affected your ability to do your job?
Cloe: For the Drought Monitoring Task Force, it hasn’t been too much of a problem, save for times when the federal government shut down and their agencies couldn’t be at the table for meetings.
What’s hit us hard is our drilling projects.
For the past four years we’ve been planning to install 20 climate response network wells, some wells for chloride monitoring, and a station to measure vertical land motion. We got the station to measure vertical land motion placed and had started on the climate response network monitors when DOGE began. The research drilling unit we worked with had several probationary employees negatively affected by DOGE cuts which slowed that project. The good news is, we now have all 20 wells in. And we’re just getting started on the 19 chloride monitoring wells.
The USGS has been a super partner in this work.
So the cutbacks didn’t stop us from monitoring drought, but it has had some impact on installing new systems.
VFP: The DEQ report on groundwater in eastern Virginia has caused quite a stir about data centers in that part of the state. Specifically, that the groundwater could not sustain a data center there. However, the report is nuanced. Can you tease out a bit more what it says about data centers and water?
Cloe: The purpose of SJ 25 was to evaluate the groundwater resource in the Virginia Coastal Plain, specifically in the Eastern Virginia Groundwater Management Area and the Eastern Shore Groundwater area – basically, everything east of I-95.
There was a part in the evaluation that said: How are emerging industries such as data centers impacting this? This report wasn’t specifically geared towards data centers. It was mainly designed to examine a big withdrawal, something that a data center might use.
So we did some research and found that data centers on the high end might draw on average 3 million gallons a day. So we modeled that and we divided the area we were looking at into different parts.
Based on areas that generally followed the drought evaluation regions, we picked a point in the center and modeled what a groundwater withdrawal of 3 million gallons would look like. And they failed.
We decided that isn’t going to tell us anything other than it can’t be done. So we reverse modeled and asked what is the maximum amount we could draw without it being a problem.
Within the Virginia Coastal Plain the range calculated was between 30,000 gallons per day to as much as 360,000 gallons per day.
What this shows is that if for some reason an industry needed 3 million gallons of water a day they couldn’t do it. It’s basically limiting large industries without it causing an issue.
VFP: Are data centers in Virginia pulling from groundwater?
Cloe: The data centers in Virginia, with the possible exception of one, are pulling off public water supplies – not groundwater. From DEQ’s perspective, we can’t say how much of public water supplies are going to data centers. Nor, for that matter, can we say how much of public water supply is going to residents or other industries.
The reporting that DEQ receives tells us the source from where water is drawn, such as the Potomac or Rappahannock River. We don’t know where it goes after it is processed and treated. So we can’t say for sure how much goes to data centers, or to residents, or to other industries.
Some legislation passed in the General Assembly this year calls for the disaggregation of public water supply data. So at the beginning of the year, the utilities will be reporting how much they send to data centers as a whole, and how much they send to residents and other industries as a whole.
VFP: So if data centers aren’t pulling from groundwater, who is?
Cloe: There are a couple of users right now that are pretty big, and both of them are paper mills. The West Point Paper Mill and the Franklin Paper Mill – both are grandfathered and have permits – but they are heavy users of groundwater, and they are having an impact on the area.
Other than that, mining is a big groundwater user, but we don’t have much of that in the eastern part of the state.
Residential, commercial, agriculture, poultry, all are heavy users of both ground and surface water.